Leukopenia refers to a reduced total white blood cell (WBC) count, while neutropenia specifically describes a decrease in neutrophils, the most abundant and infection‑responsive WBC subtype. From an engineering standpoint, these terms are not abstract diagnoses but numerical outcomes produced by blood analysis systems that count, classify, and validate millions of cells in a few seconds.
In routine practice, leukopenia is typically flagged when total WBC values fall below about 4,000 cells per microliter (4.0 ×10⁹/L), while neutropenia is usually recognized when absolute neutrophil counts drop below roughly 1,500 cells/µL (1.5 ×10⁹/L). These thresholds are medical conventions, but the engineer’s focus is on how reliably instruments detect and separate these cells in real-world conditions.
Measurement Principles
Modern blood analyzers work by converting physical cell properties into measurable signals. Each white blood cell passing through the system generates electrical, optical, or light‑scattering data. The analyzer does not “see” leukopenia; it measures thousands of individual events and calculates whether the final counts fall below predefined reference ranges.
From an engineering view, accuracy depends on stable sample flow, precise timing, and consistent signal acquisition. A difference of a few hundred cells per microliter (or 0.1–0.3 ×10⁹/L) can change a result from normal to abnormal, which means even small mechanical or electronic deviations can have clinical consequences.
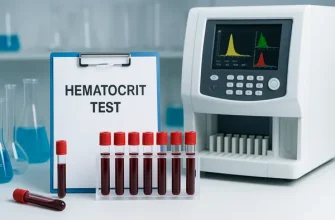
Automated Analyzers
Most clinical laboratories rely on fully automated hematology analyzers. These systems integrate microfluidics, pumps, valves, detectors, and embedded software into a single platform. Blood volumes are extremely small—often just a few microliters (µL), equivalent to fractions of a drop—yet they must represent the entire circulating cell population.
From my engineering experience, I often see a common real‑world issue: analyzers that are technically functional but poorly maintained. In several U.S. laboratories I worked with, low white blood cell counts were repeatedly reported until routine maintenance revealed partially clogged sample lines and aging peristaltic tubing. After replacement and recalibration, leukocyte values returned to expected ranges without any change in patient condition.
When I am involved in purchasing or upgrading analyzers, I always advise engineers and lab managers to prioritize mechanical reliability and service accessibility over marginal gains in advertised speed. A slightly slower system with stable fluidics and readily available spare parts often produces more consistent results than a high‑throughput platform operating near its mechanical limits.
Neutrophil Detection
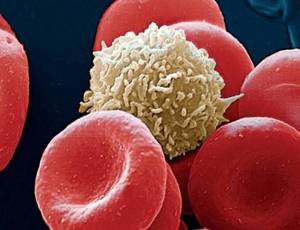
Neutrophils are not counted directly by name; they are identified by characteristic signal patterns. Size, internal complexity, and staining behavior distinguish neutrophils from lymphocytes, monocytes, eosinophils, and basophils. The analyzer’s algorithms classify each detected event into a category based on probability models.
In one practical case I encountered during equipment validation, abnormal neutrophil distributions were traced not to patient pathology but to degraded optical filters in the detection module. The issue subtly altered light scatter patterns, leading to under‑classification of neutrophils. From my perspective, this is a clear reminder that optical components should be treated as critical consumables, not permanent fixtures.
Neutrophils are not counted directly by name; they are identified by characteristic signal patterns. Size, internal complexity, and staining behavior distinguish neutrophils from lymphocytes, monocytes, eosinophils, and basophils. The analyzer’s algorithms classify each detected event into a category based on probability models.
In neutropenia, the challenge is not just low numbers but statistical confidence. When counts are very low, the system must avoid misclassifying debris or abnormal cells as neutrophils, which requires robust discrimination thresholds and noise filtering.
Signal Processing
Raw signals from detectors are meaningless without processing. Analog signals are digitized, filtered, and mapped into multidimensional plots. Software then applies classification rules developed from large reference datasets. In simple terms, leukopenia and neutropenia are software conclusions derived from physics‑based measurements.
According to Mammadli, one of the most underestimated aspects is firmware logic. Updates to algorithms can slightly shift reported counts without any change in hardware, which is why engineers track software versions as carefully as physical components.
Modern Technologies
Recent systems incorporate digital morphology, advanced flow cytometry, and machine‑learning‑assisted classification. These technologies improve differentiation in complex samples and reduce false flags. Some platforms can now recognize subtle neutrophil abnormalities that older impedance‑only systems could not detect.
Mammadli notes that future development is moving toward tighter integration of hardware and AI‑driven analytics, where continuous learning models refine classification accuracy across diverse patient populations.
Editorial Advice
From an engineering viewpoint, leukopenia and neutropenia are best understood as measurement outcomes rather than abstract conditions. Patients and clinicians should remember that reported numbers reflect the performance of sophisticated machines operating under defined limits.
If repeated results show low white blood cell or neutrophil counts, testing should be performed in certified laboratories with properly maintained equipment and validated software. Reliable data begins with reliable technology, and understanding how these systems work helps interpret results with appropriate confidence.
References
White Blood Cell Count (overview and interpretation) – Mayo Clinic
https://www.mayoclinic.org
Neutropenia (clinical background and thresholds) – Cleveland Clinic
https://my.clevelandclinic.org
Complete Blood Count (CBC) Explained (laboratory principles) – Johns Hopkins Medicine
https://www.hopkinsmedicine.org
Hematology Analyzers (technology overview) – National Center for Biotechnology Information
https://www.ncbi.nlm.nih.gov
Laboratory Quality Control in Hematology (standards and practices) – Centers for Disease Control and Prevention
https://www.cdc.gov
White Blood Cells and Immune Function (educational resource) – National Institutes of Health
https://www.nih.gov